Graph Types
The two main graphs are the Everyday Weather and Temperature graphs.
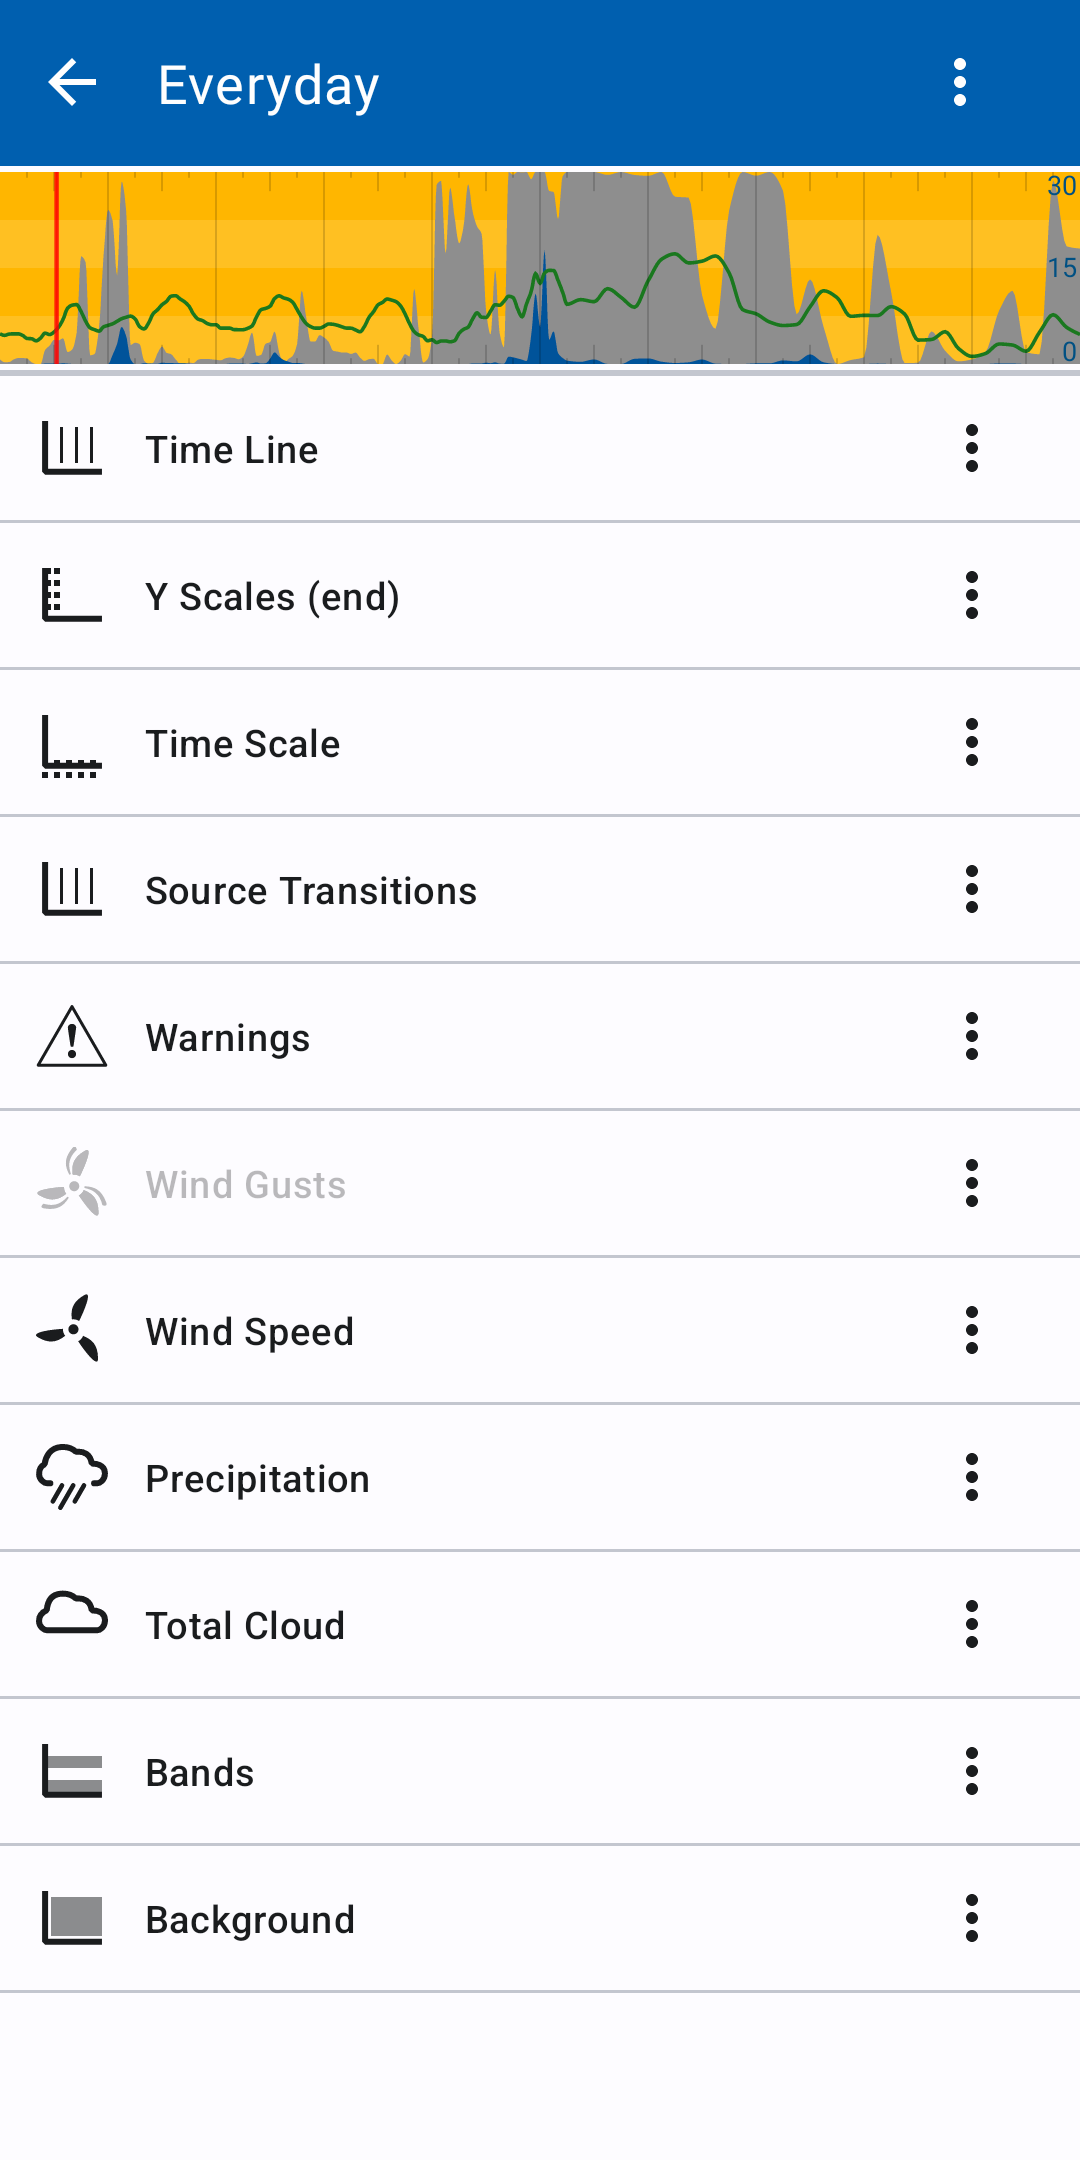
Everyday Weather
OR
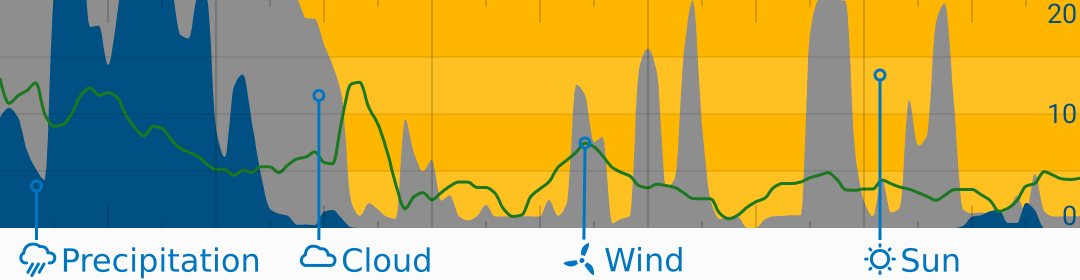
This graph is a great way to see the weeks' weather at a glance. It shows:
- Precipitation (water is blue):
- Range: 0 - 4 mm/hr or 0 - 0.15 in/hr
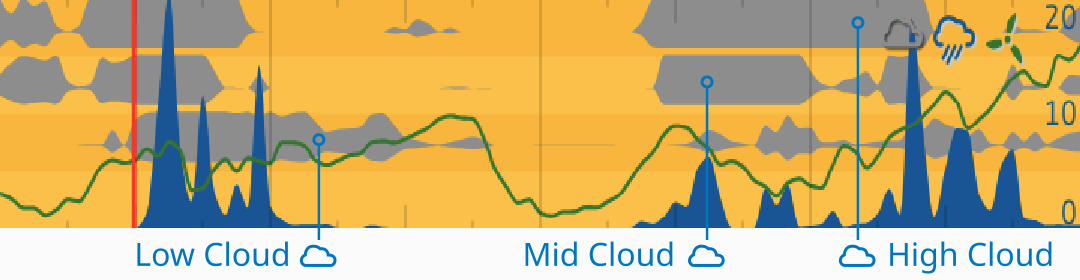
- Low, Mid, High or Total cloud (clouds are grey):
- The low, mid and high clouds will be shown if available, otherwise it will fallback to total cloud.
- Range: 0 - 100 %
- Wind speed in green.
- Range: 0 - 20 kt (right scale)
- Sunny weather is indicated by the yellow background
Temperature
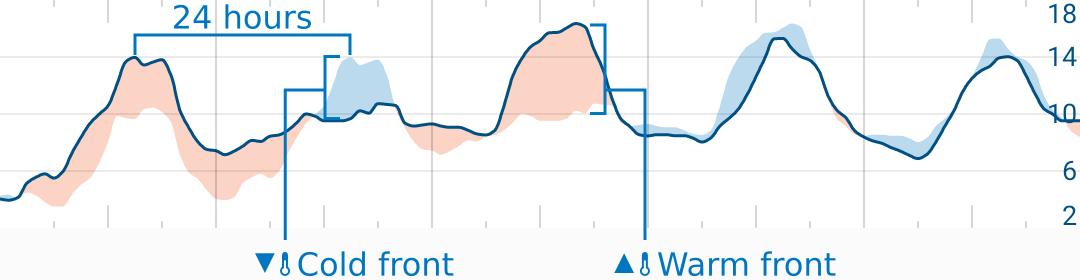
The blue and red areas show the change in temperature from the same time the day before. This is a great way to see when it gets warmer or colder (or warm and cold fronts) at a glance.
Range: auto
Units: °C or °F
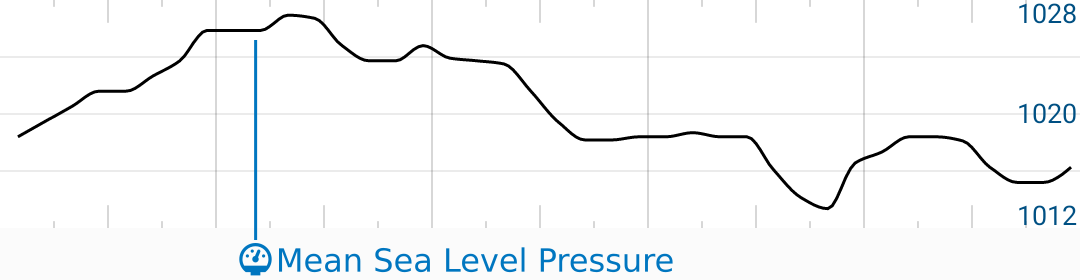
Mean Sea-Level Pressure Graph (Units: hPa. Range: auto)
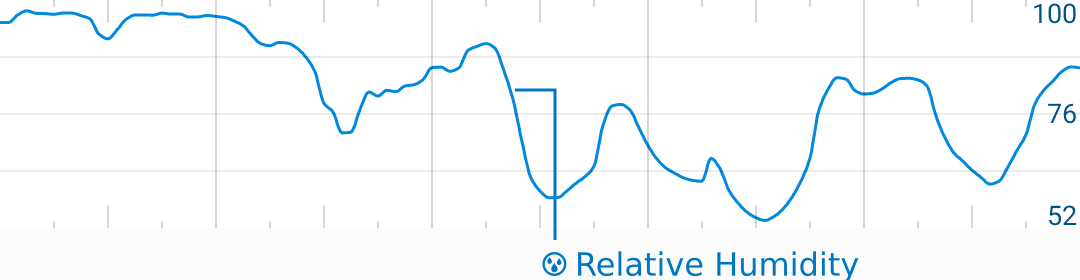
Relative Humidity Graph (Units: %, Range: auto)
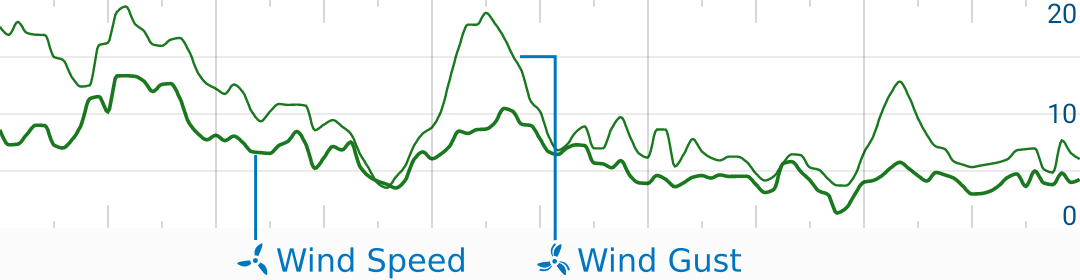
Wind Speed and Gust Graph (Range: 0-20 kt)
Graph Menu
Long press on a graph to access the graph menu:
- Compare Mode
- Edit Range
- Edit Graph
- Add/Delete
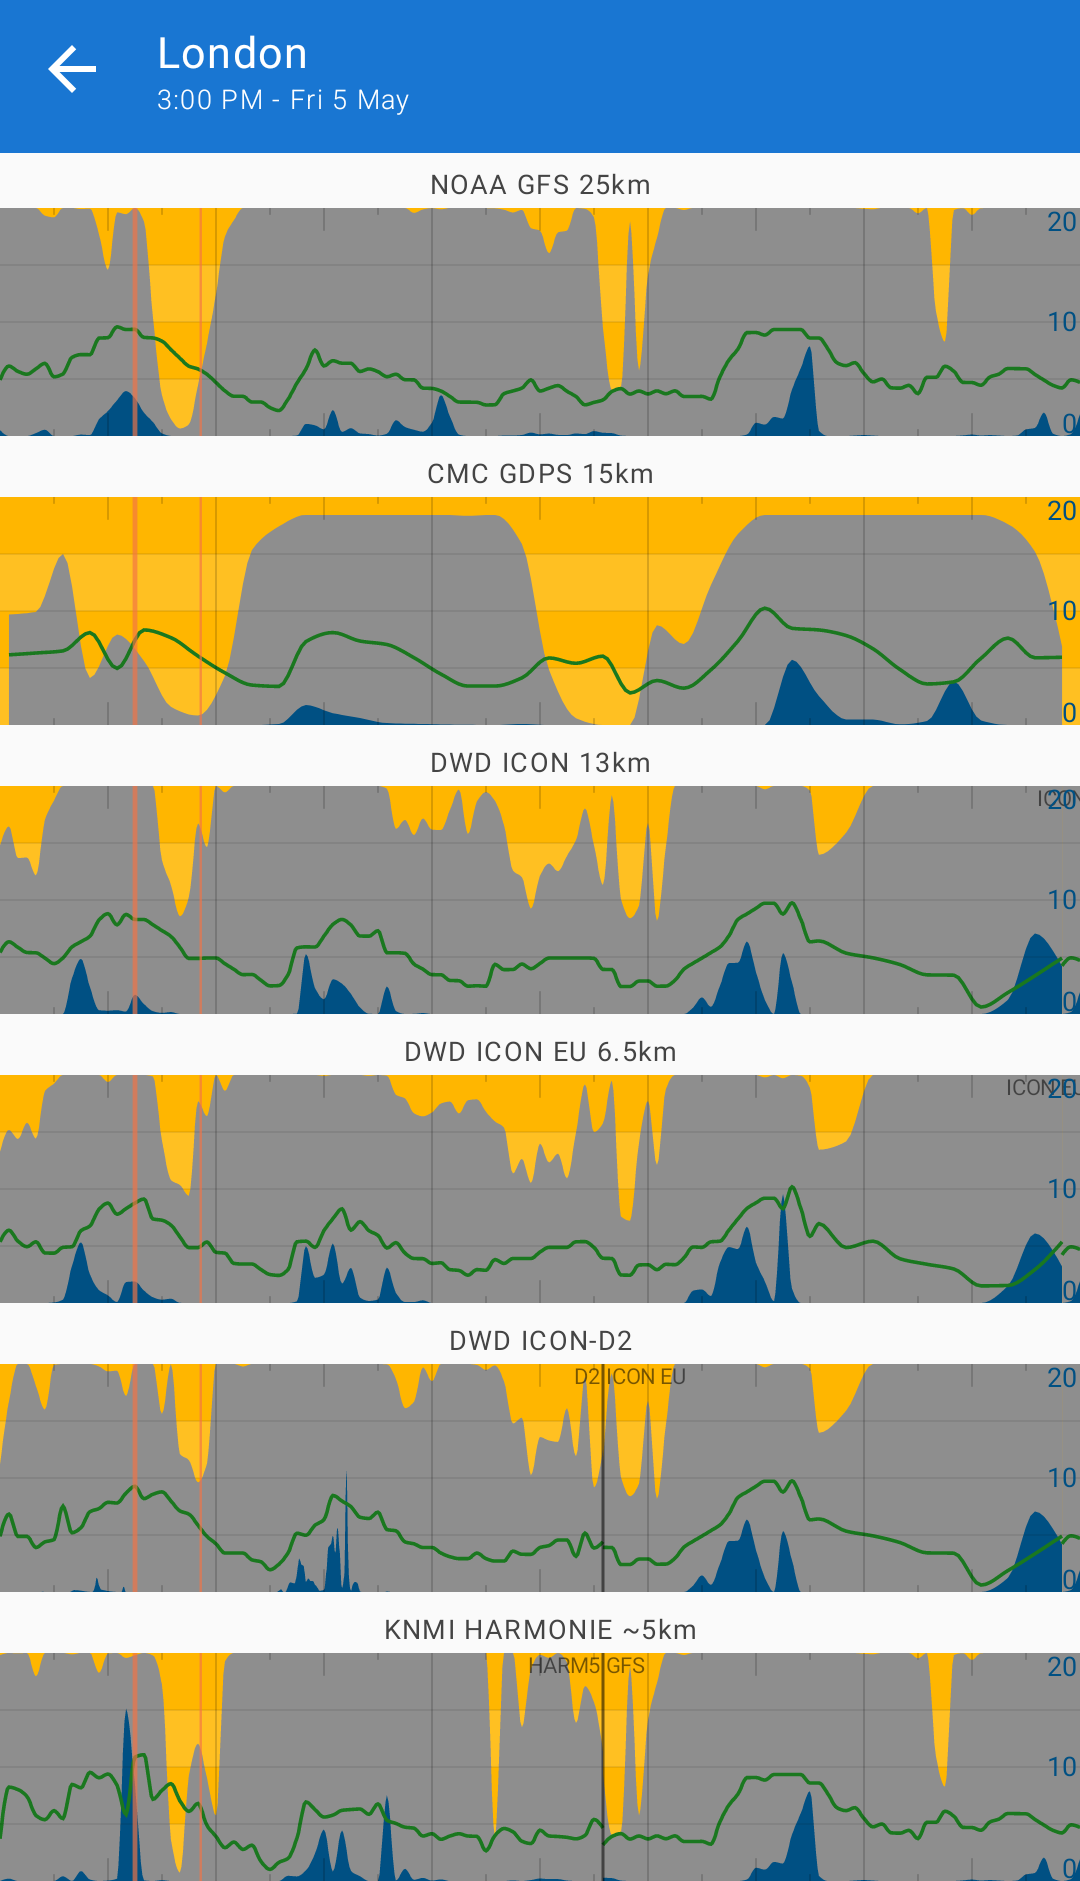
Compare Mode
Compare model is a useful tool for comparing predictions across many data sources.
If you double-tap on any graph, Flowx will show you a stack of graphs - one for each data source.
While in compare mode, you can double-tap on any graph to return to the main screen and show the selected source.
Edit Graph Range
This feature allows you to set y-scale value range for data types used in the graphs. These are saved for each location, i.e., they are not globally set for all graphs and places. Typically, default scale ranges will be used, but sometimes it is useful to adjust these based on the location. A good example is temperature - you may use a different range in a cold location compared to a hot location.
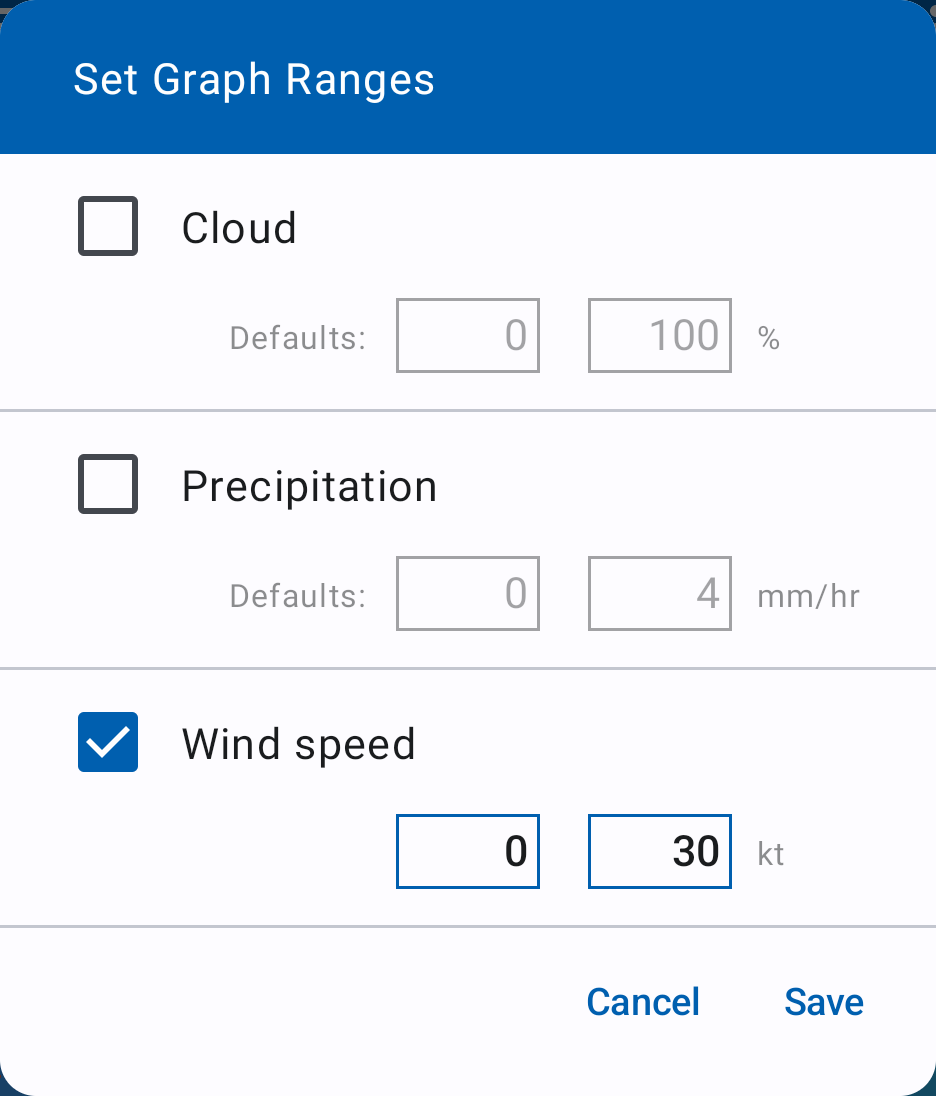
The unchecked ranges will use the apps default value ranges which are shown as a shaded color.
If you check a range, you can manually set the values for the range.
If a range value is left blank, the range will default to the minimum or maximum value of the data for that location. In this case, the scales will likely change between data sources or updates.
Graph Editor
The Graph Editor is a PRO feature that allows you to add data plots to your graph along with editing the style of the graph. You can edit a specific graph by long-pressing on the graph and clicking Edit Graph.
The graph editor will show the graph being edited and a list of associated elements. The list is ordered from the bottom layer up to the top layer.
You can Toggle Visibility of each element by clicking on the elements in the list.
Each element has a menu of actions you can perform:
- Edit will show a pop-up to edit the element style. See below for more details.
- Move Elements up or down.
- Add Elements above or below the current element.
- Delete Elements
Warning
The graph editor is a beta feature that is still actively developed. As such you may lose changes you make in the future.
Adding Elements
Various elements can be added to a graph. Most are data plots but there several non-data elements:
- Time Marks - vertical lines indicating the current time and the view (scrolled) time.
- Legend - shows icons of the plotted data in the top-right in the color associated with the graph element.
- Y-Scales (start/end) - adds scales with lines to either the start or end of the graph.
- Time Grid - adds vertical lines demarcating days and indicating the 0600, 1200 and 1800 hour times.
- Fixed Data Levels - adds horizontal lines indicating user defined levels of the data, e.g., the freezing temperature line.
- Source Transitions - shows the separation between data sources when a graph uses multiple sources.
- Source Transitions Labels - adds labels to the source transition lines.
- Warnings - shows warnings when a data source does not include a data type required for the graph.
- Bands - shades in alternating horizontal bands which can be used instead of lines from the y-scales.
- Background - fills in the background with a color.
Editing Element Styles
Various element properties can be adjusted depending on the type of the element. Leaving any property blank will result in teh default value being used.
Line Width
Sets the width of any lines associated with the element. Setting the value to "0" will result in no lines being drawn.
Text Size
Sets the font size of the text associated with the element. Setting the value to "0" will result in no text being drawn.
Color
Sets the color of particular elements using a color picker.
Plot Type
Data can take the form of a Line, Fill or Delta. A Delta plot a line and filled regions that shows the change in the data compared to the same time 24 hours prior. An example of this is in the Temperature graph
Range
The Range property sets the data type to be used for the y-scales.
Future Work
- Create new graphs
- Copy graphs
- Export/Import graphs
- Share graphs